

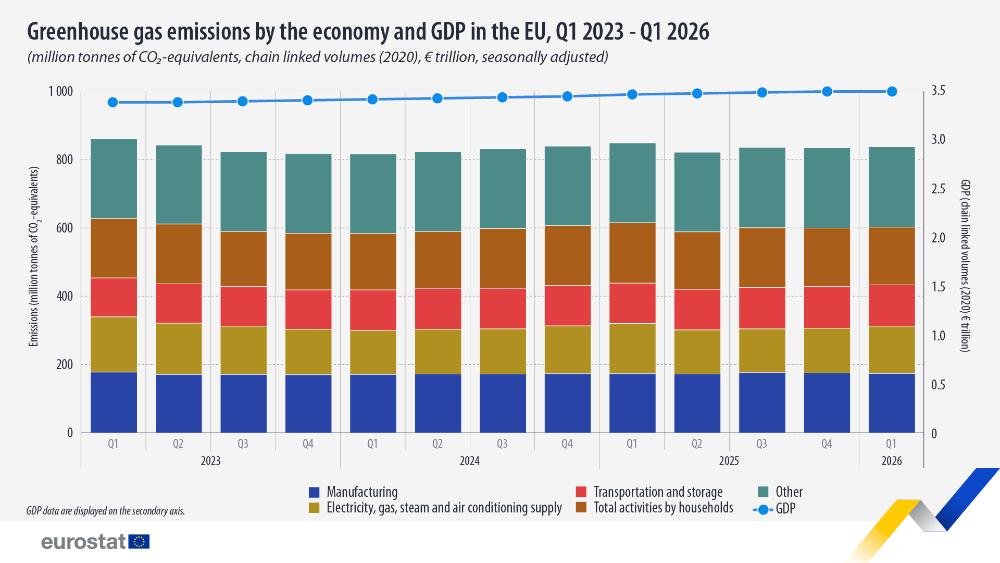
The EU economy’s seasonally adjusted greenhouse gas emissions in the first quarter of 2026 were estimated at 837 million tonnes of CO2-equivalents (CO2-eq), a 0.3% increase compared with the fourth quarter of 2025 (835 million tonnes of CO2-eq). At the same time, there was no change to the EU’s gross domestic product (GDP) in the first quarter of 2026, compared with the last quarter of 2025.
The economic sector with the largest increase in greenhouse gas emissions was electricity, gas, steam and air conditioning supply (+4.8%), while households (-1.3%), manufacturing and transportation and storage (both -0.6%) recorded the biggest decreases.
Source datasets: env_ac_aigg_q and namq_10_gdp
Compared with the first quarter of 2025, emissions went down by 1.2%, while the EU’s GDP increased by 0.8%.
Greenhouse gas emissions decreased in 7 EU countries
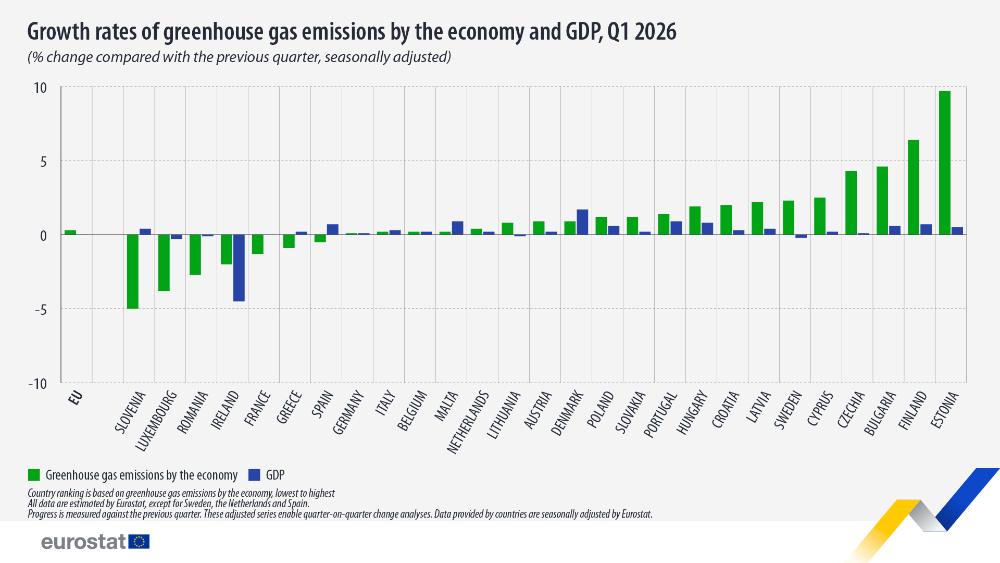
In the first quarter of 2026, seasonally adjusted greenhouse gas emissions increased in 20 EU countries and decreased in 7 countries, compared with the fourth quarter of 2025.
The largest reductions in greenhouse gases were estimated for Slovenia (-5.0%), Luxembourg (-3.8%) and Romania (-2.7%).
The largest increases in greenhouse gas emissions were estimated for Estonia (+9.7%), Finland (+6.4%) and Bulgaria (+4.6%). The increases in these countries are largely due to growing emissions by economic producers in construction and electricity, gas, steam and air conditioning supply.
In the first quarter of 2026, 20 EU countries recorded increases in greenhouse gas emissions, out of which 18 also increased their GDP. 7 countries reduced their greenhouse gas emissions. Out of these, 4 countries recorded a higher or stable GDP.
Source datasets: env_ac_aigg_q and namq_10_gdp
This information comes from data on seasonally adjusted quarterly estimates of greenhouse gas emissions by economic activity, published by Eurostat today. Quarterly estimates of greenhouse gas emissions complement quarterly socio-economic data, such as GDP or employment.