

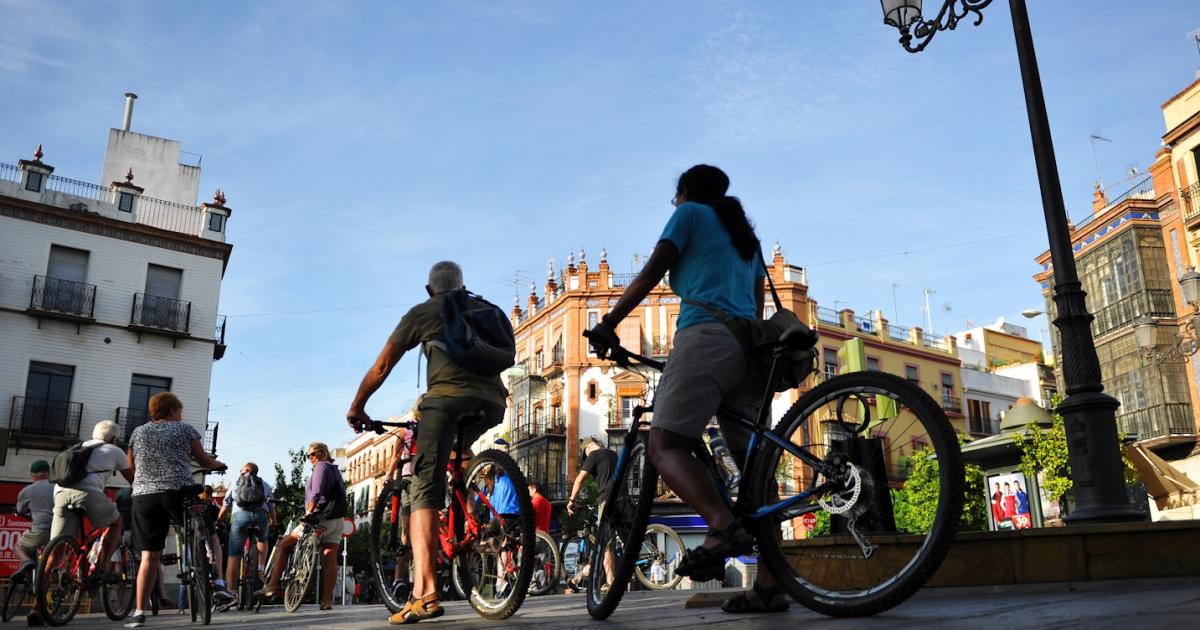
When a visitor books a hotel room in Seville or a dinner in Dubrovnik, the economic effect does not stop at the till. The hotel buys linen and electricity, and the restaurant buys fish and wine from local suppliers. The people who work there spend their wages in shops, schools and services nearby. Until now, official EU figures captured only the first of these steps.
New estimates by the JRC now measure all three. They include not just tourism’s direct contribution, but also its impact on supply chains, and the spending of income earned in the sector.
They show that, on average across the EU countries covered, tourism’s total economic impact accounts for an estimated 10.1% of gross value added (GVA). That is nearly two and a half times its direct contribution, 4.1%. GVA measures the economic output produced by businesses and sectors and can act as a proxy for gross domestic product (GDP).
The direct share has recovered since 2022, when it stood at 3.6%, and the sector was still emerging from the COVID-19 crisis.
The JRC estimates inform the EU Strategy for Sustainable Tourism, adopted by the Commission today, to quantify the economic weight of the sector. They are available as a new indicator in the EU Tourism Dashboard.
Where tourism weighs most
Tourism’s weight varies widely across Europe. In countries with high tourism activity, such as Italy and Spain, the newly estimated total impact is around 14% of GVA. In Portugal and Croatia, it surpasses 20%. In Belgium and Denmark, on the other hand, it is slightly below 5%.
Filling a data gap
This is the first time the European Commission has published its own estimates of tourism’s total economic impact.
The economic value of tourism is hard to measure. Tourism is not an industry in the national accounts, but an activity defined by who consumes, and separating visitors’ spending from residents’ spending is methodologically complex. Tourism Satellite Accounts were designed to fill this gap. However, EU-level data from Eurostat covers direct impact only, relies on voluntary submissions by Member States and is still published as experimental statistics. As a result, the Commission has relied on estimates from industry organisations until now.
The JRC method addresses this using official statistics only. It starts from the Tourism Satellite Accounts compiled by national statistical offices and combines them with Eurostat input-output tables, which show how much each sector of the economy buys from the others, and nights spent at tourist accommodation establishments, to monitor the evolution of tourism demand. This makes it possible to trace how visitor spending flows through supply chains and household incomes. Because the same method is applied to every country, the results can be compared across Europe. The full methodology is set out in a peer-reviewed article by researchers from the JRC and the University of Bologna, published in Current Issues in Tourism.
Background
A clear view of tourism’s total impact, and of how it varies between countries, gives policymakers, national authorities and destination management organisations a sound basis for decisions. It helps them design proportionate measures that support sustainable growth, allocate public resources efficiently and monitor how well the sector withstands shocks.
The EU Tourism Dashboard, launched in 2022 at the request of EU countries, is developed and maintained by the JRC for the Directorate-General for Mobility and Transport (DG MOVE) of the European Commission. It brings together indicators that help countries and regions track the environmental, digital and socio-economic performance of tourism, and now includes the new indicator on total economic impact.
Related links
EU Strategy for Sustainable Tourism
Methodological article: Give me a number. Evaluating economic impacts of tourism