

Overview
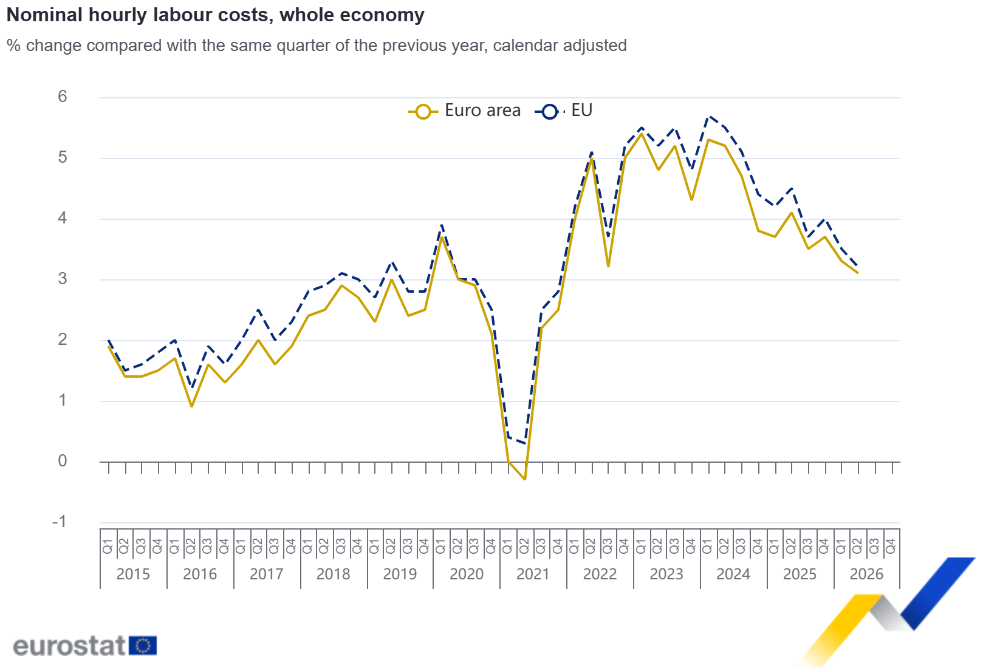
In the second quarter of 2026 the hourly labour costs rose by 3.1% in the euro area and by 3.2% in the EU, compared with the same quarter of the previous year. These figures are published by Eurostat, the statistical office of the European Union.
The two main components of labour costs are wages & salaries and non-wage costs.
In the euro area, in the second quarter of 2026 compared with the same quarter of the previous year
In the EU, in the second quarter of 2026 compared with the same quarter of the previous year
Breakdown by economic activity
In the second quarter of 2026 compared with the same quarter of the previous year, hourly labour costs in the euro area rose by 3.1% in the (mainly) non-business economy and by 3.0% in the business economy:
-
+2.9% in industry,
In the EU, hourly labour costs grew by 3.3% in (mainly) non-business economy and by 3.1% in the business economy:
-
+3.0% in industry,
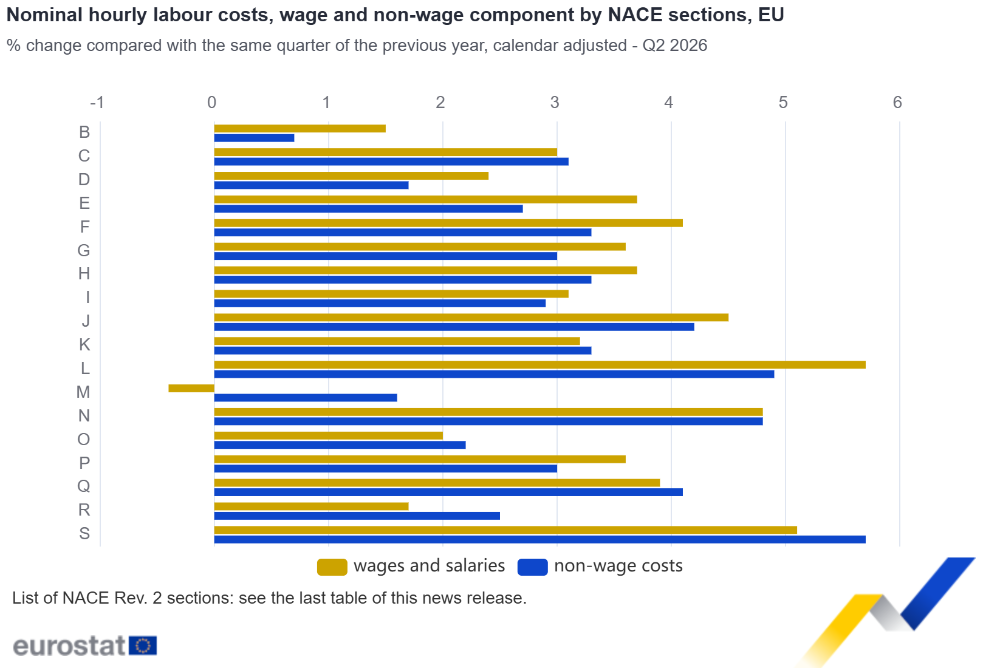
In the EU, in the second quarter of 2026 compared with the same quarter of the previous year, the economic activities (NACE Rev. 2 sections) that recorded the highest increases in hourly wage costs were:
-
L – ‘Real estate activities’ (+5.7%) followed by
-
S – ‘Other service activities’ (+5.1%),
-
N – ‘Administrative and support service activities’ (+4.8%).
The lowest annual increase was recorded in NACE Rev. 2 section B – ‘Mining and quarrying’ (+1.5%) followed by NACE Rev. 2 section R – ‘Arts, entertainment and recreation’ (+1.7%) whereas NACE Rev. 2 section M – ‘Professional, scientific and technical activities’ recorded a decrease (-0.4%).
In the EU, in the second quarter of 2026 compared with the same quarter of the previous year, the economic activities (NACE Rev. 2 sections) that recorded the highest increases in the non-wage component were:
-
S – ‘Other service activities’ (+5.7%) followed by
-
L – ‘Real estate activities’ (+4.9%),
-
N – ‘Administrative and support service activities’ (+4.8%).
The lowest annual increase was recorded in NACE Rev. 2 section B – ‘Mining and quarrying’ (+0.7%) followed by NACE Rev. 2 section M – ‘Professional, scientific and technical activities’ (+1.6%) and NACE Rev. 2 section D – ‘Electricity, gas, steam and air conditioning supply’ (+1.7%).
Hourly wage costs across countries
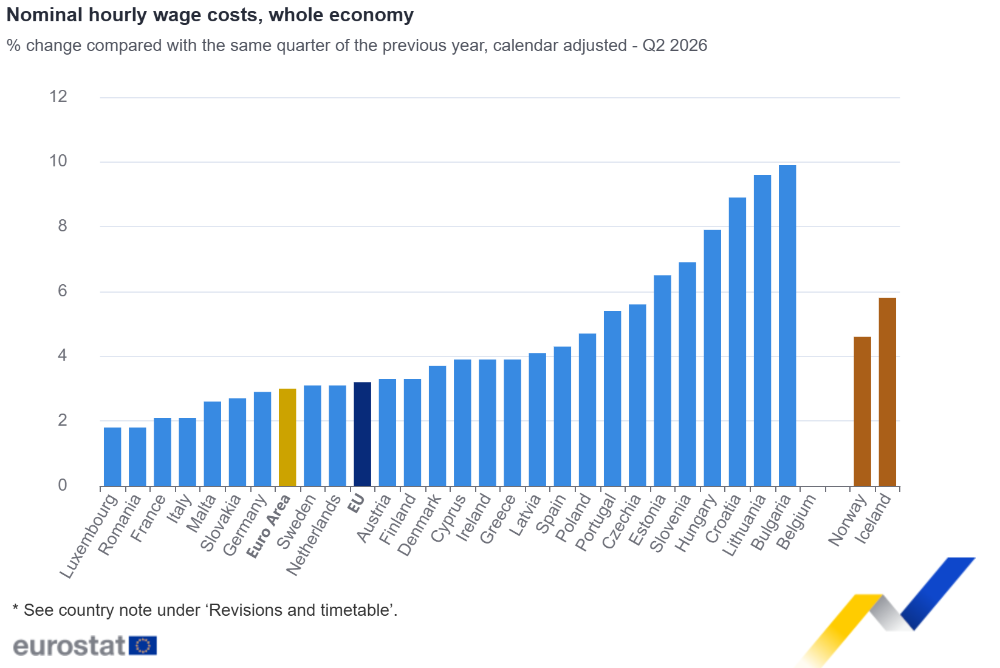
In the second quarter of 2026 compared with the same quarter of the previous year, the highest increases in hourly wage costs for the whole economy were recorded in Bulgaria (+9.9%), Lithuania (+9.6%) and Croatia (+8.9%). The lowest increases were recorded in Luxembourg and Romania (+1.8% each) followed by France and Italy (+2.1% each).
Tables
|
Nominal hourly labour costs of whole economy (NACE Rev. 2 sections B to S) % change compared with same quarter of previous year – calendar adjusted |
|||||||||
|---|---|---|---|---|---|---|---|---|---|
|
Q2 2025 |
Q1 2026 |
Q2 2026 |
|||||||
|
TOTAL |
WAGES |
OTHER |
TOTAL |
WAGES |
OTHER |
TOTAL |
WAGES |
OTHER |
|
|
4.1 |
4.1 |
4.2 |
3.3 |
3.4 |
2.8 |
3.1 |
3.0 |
3.2 |
|
|
4.5 |
4.4 |
4.5 |
3.5 |
3.7 |
3.1 |
3.2 |
3.2 |
3.2 |
|
|
3.3 |
3.3 |
3.3 |
: |
: |
: |
: |
: |
: |
|
|
13.2 |
13.4 |
12.3 |
13.4 |
13.2 |
14.2 |
9.9 |
9.9 |
10.0 |
|
|
6.8 |
6.8 |
6.9 |
5.0 |
5.1 |
5.0 |
5.6 |
5.6 |
5.6 |
|
|
2.2 |
1.5 |
6.3 |
3.1 |
2.5 |
6.3 |
3.6 |
3.7 |
2.5 |
|
|
4.3 |
4.5 |
3.6 |
2.9 |
3.3 |
1.6 |
3.0 |
2.9 |
3.3 |
|
|
10.3 |
10.3 |
10.6 |
6.2 |
6.3 |
6.1 |
6.5 |
6.5 |
6.5 |
|
|
3.1 |
3.1 |
3.6 |
4.0 |
3.2 |
9.7 |
4.1 |
3.9 |
5.3 |
|
|
9.7 |
10.1 |
7.9 |
6.5 |
6.4 |
6.8 |
3.9 |
3.9 |
3.9 |
|
|
3.7 |
3.4 |
4.6 |
5.2 |
5.2 |
5.1 |
4.3 |
4.3 |
4.4 |
|
|
2.1 |
1.7 |
3.0 |
1.9 |
1.9 |
1.9 |
2.1 |
2.1 |
2.2 |
|
|
9.5 |
9.3 |
10.6 |
9.6 |
9.2 |
12.2 |
9.4 |
8.9 |
12.0 |
|
|
3.7 |
3.4 |
4.5 |
2.8 |
2.7 |
3.1 |
2.2 |
2.1 |
2.5 |
|
|
3.7 |
3.7 |
3.6 |
3.4 |
3.4 |
3.0 |
3.8 |
3.9 |
3.6 |
|
|
8.7 |
8.5 |
9.1 |
3.0 |
3.2 |
2.2 |
4.5 |
4.1 |
6.2 |
|
|
9.3 |
9.4 |
7.3 |
8.6 |
8.6 |
6.6 |
9.6 |
9.6 |
10.1 |
|
|
3.0 |
3.0 |
3.2 |
4.2 |
3.9 |
7.2 |
2.1 |
1.8 |
5.7 |
|
|
10.8 |
10.9 |
10.4 |
16.0 |
16.4 |
12.8 |
7.8 |
7.9 |
7.2 |
|
|
1.8 |
1.9 |
0.1 |
1.7 |
1.7 |
1.8 |
2.5 |
2.6 |
0.3 |
|
|
6.8 |
6.7 |
7.2 |
3.9 |
3.9 |
4.0 |
3.1 |
3.1 |
3.2 |
|
|
3.7 |
3.5 |
4.5 |
3.8 |
3.7 |
4.3 |
3.4 |
3.3 |
4.0 |
|
|
9.7 |
9.6 |
9.8 |
7.2 |
7.2 |
7.3 |
4.7 |
4.7 |
4.7 |
|
|
5.5 |
5.5 |
5.4 |
5.3 |
5.3 |
5.3 |
5.4 |
5.4 |
5.2 |
|
|
10.3 |
10.3 |
10.5 |
3.8 |
3.8 |
3.6 |
1.8 |
1.8 |
1.9 |
|
|
7.5 |
7.5 |
7.2 |
3.4 |
3.5 |
2.7 |
7.0 |
6.9 |
7.3 |
|
|
9.8 |
9.6 |
10.3 |
5.6 |
5.4 |
6.0 |
2.8 |
2.7 |
3.1 |
|
|
4.6 |
4.3 |
6.1 |
4.0 |
3.7 |
5.2 |
3.5 |
3.3 |
4.3 |
|
|
4.9 |
4.6 |
5.6 |
2.9 |
3.2 |
2.3 |
2.6 |
3.1 |
1.4 |
|
|
7.2 |
8.3 |
2.1 |
2.6 |
4.0 |
-5.0 |
4.5 |
4.6 |
5.3 |
|
|
12.7 |
12.6 |
13.1 |
6.1 |
6.0 |
6.6 |
5.9 |
5.8 |
6.3 |
|
|
Nominal hourly labour costs of business economy (NACE Rev. 2 sections B to N) % change compared with same quarter of previous year – calendar adjusted |
|||||||||
|---|---|---|---|---|---|---|---|---|---|
|
Q2 2025 |
Q1 2026 |
Q2 2026 |
|||||||
|
TOTAL |
WAGES |
OTHER |
TOTAL |
WAGES |
OTHER |
TOTAL |
WAGES |
OTHER |
|
|
4.5 |
4.4 |
4.6 |
3.3 |
3.4 |
3.0 |
3.0 |
3.0 |
3.2 |
|
|
4.8 |
4.8 |
4.9 |
3.5 |
3.6 |
3.2 |
3.1 |
3.1 |
3.2 |
|
|
3.6 |
3.6 |
3.5 |
: |
: |
: |
: |
: |
: |
|
|
12.8 |
12.9 |
12.2 |
12.9 |
12.8 |
13.7 |
11.5 |
11.4 |
12.2 |
|
|
7.0 |
7.0 |
7.2 |
5.3 |
5.3 |
5.2 |
5.3 |
5.3 |
5.3 |
|
|
2.3 |
1.8 |
5.3 |
2.9 |
2.4 |
5.8 |
2.8 |
2.9 |
2.1 |
|
|
4.7 |
4.9 |
4.1 |
2.8 |
3.2 |
1.4 |
2.9 |
2.9 |
3.0 |
|
|
11.9 |
11.8 |
12.0 |
5.4 |
5.3 |
5.6 |
5.0 |
4.9 |
5.2 |
|
|
3.3 |
3.3 |
3.4 |
3.6 |
2.6 |
10.3 |
4.2 |
4.1 |
4.7 |
|
|
10.3 |
10.7 |
8.1 |
7.2 |
7.5 |
6.0 |
6.1 |
6.1 |
5.8 |
|
|
4.2 |
3.7 |
5.5 |
4.3 |
4.1 |
4.8 |
3.7 |
3.5 |
4.4 |
|
|
2.3 |
2.1 |
3.0 |
2.3 |
2.2 |
2.6 |
2.4 |
2.3 |
2.7 |
|
|
11.2 |
10.9 |
12.8 |
11.3 |
10.8 |
14.3 |
10.7 |
10.2 |
13.8 |
|
|
4.4 |
3.8 |
5.8 |
3.1 |
2.9 |
3.5 |
2.0 |
1.8 |
2.4 |
|
|
4.1 |
4.1 |
4.1 |
4.4 |
4.4 |
4.5 |
4.3 |
4.3 |
4.3 |
|
|
8.6 |
8.4 |
9.5 |
3.3 |
3.6 |
2.3 |
5.5 |
4.9 |
7.7 |
|
|
8.4 |
8.5 |
6.7 |
7.9 |
8.1 |
4.4 |
9.8 |
9.8 |
10.2 |
|
|
1.3 |
1.2 |
1.6 |
4.1 |
3.8 |
7.1 |
2.6 |
2.2 |
6.6 |
|
|
9.6 |
9.6 |
9.9 |
7.8 |
8.0 |
6.6 |
7.7 |
7.8 |
6.9 |
|
|
1.5 |
1.6 |
1.1 |
2.1 |
1.9 |
5.9 |
3.5 |
3.6 |
2.4 |
|
|
7.2 |
7.0 |
8.0 |
4.1 |
4.0 |
4.4 |
3.4 |
3.5 |
3.2 |
|
|
4.8 |
4.6 |
5.6 |
3.8 |
3.6 |
4.4 |
3.4 |
3.2 |
3.9 |
|
|
9.5 |
9.4 |
9.6 |
6.9 |
6.9 |
7.0 |
4.5 |
4.5 |
4.5 |
|
|
3.3 |
3.2 |
3.4 |
5.2 |
5.2 |
5.2 |
5.7 |
5.7 |
5.4 |
|
|
11.6 |
11.6 |
11.6 |
5.8 |
5.8 |
5.5 |
3.4 |
3.4 |
3.3 |
|
|
5.7 |
5.7 |
5.5 |
4.0 |
4.1 |
3.0 |
6.7 |
6.7 |
7.2 |
|
|
8.1 |
7.8 |
8.7 |
4.7 |
4.4 |
5.3 |
4.4 |
4.3 |
5.0 |
|
|
4.2 |
3.8 |
5.9 |
3.7 |
3.5 |
4.5 |
2.7 |
2.6 |
3.2 |
|
|
5.2 |
4.8 |
6.1 |
2.5 |
2.9 |
1.6 |
2.4 |
3.1 |
0.9 |
|
|
7.8 |
9.3 |
0.6 |
3.2 |
5.4 |
-7.9 |
5.4 |
5.4 |
7.0 |
|
|
11.8 |
11.6 |
12.2 |
6.2 |
6.1 |
6.5 |
6.2 |
6.2 |
6.6 |
|
|
Nominal hourly labour costs of mainly non-business economy (NACE Rev. 2 sections O to S) % change compared with same quarter of previous year – calendar adjusted |
|||||||||
|---|---|---|---|---|---|---|---|---|---|
|
Q2 2025 |
Q1 2026 |
Q2 2026 |
|||||||
|
TOTAL |
WAGES |
OTHER |
TOTAL |
WAGES |
OTHER |
TOTAL |
WAGES |
OTHER |
|
|
3.3 |
3.3 |
3.3 |
3.2 |
3.5 |
2.5 |
3.1 |
3.1 |
3.2 |
|
|
3.7 |
3.7 |
3.6 |
3.7 |
3.9 |
2.9 |
3.3 |
3.3 |
3.2 |
|
|
2.6 |
2.7 |
2.5 |
: |
: |
: |
: |
: |
: |
|
|
14.6 |
15.1 |
12.6 |
15.1 |
15.0 |
15.5 |
5.4 |
5.5 |
5.1 |
|
|
6.3 |
6.3 |
6.2 |
4.3 |
4.3 |
4.3 |
6.5 |
6.5 |
6.5 |
|
|
1.9 |
0.9 |
8.4 |
3.3 |
2.7 |
7.2 |
5.0 |
5.2 |
3.4 |
|
|
3.3 |
3.5 |
2.6 |
3.2 |
3.8 |
1.9 |
3.3 |
3.2 |
3.9 |
|
|
6.9 |
6.8 |
7.2 |
8.6 |
8.9 |
7.9 |
10.2 |
10.4 |
9.6 |
|
|
2.7 |
2.6 |
:c |
4.8 |
4.5 |
:c |
3.8 |
3.5 |
:c |
|
|
8.6 |
9.0 |
7.6 |
5.4 |
4.6 |
7.8 |
-0.2 |
-0.7 |
1.3 |
|
|
2.6 |
2.6 |
2.5 |
7.3 |
7.9 |
5.6 |
5.7 |
6.1 |
4.3 |
|
|
1.6 |
0.9 |
3.1 |
1.0 |
1.1 |
0.8 |
1.5 |
1.6 |
1.4 |
|
|
6.4 |
6.3 |
6.8 |
6.3 |
6.0 |
8.2 |
6.9 |
6.6 |
8.7 |
|
|
2.2 |
2.3 |
2.0 |
2.3 |
2.3 |
2.4 |
2.9 |
2.9 |
2.9 |
|
|
2.9 |
2.9 |
2.9 |
0.6 |
0.7 |
0.5 |
2.5 |
2.6 |
2.3 |
|
|
8.7 |
8.9 |
8.0 |
2.2 |
2.2 |
1.9 |
2.2 |
2.1 |
2.6 |
|
|
11.5 |
11.6 |
9.1 |
10.1 |
10.0 |
13.0 |
9.2 |
9.2 |
10.1 |
|
|
7.8 |
7.7 |
8.0 |
4.5 |
4.2 |
7.3 |
0.9 |
0.7 |
3.2 |
|
|
14.1 |
14.4 |
11.9 |
37.5 |
38.7 |
28.4 |
8.2 |
8.2 |
8.1 |
|
|
1.9 |
2.2 |
-1.1 |
0.9 |
1.3 |
-2.9 |
0.4 |
0.7 |
-2.1 |
|
|
5.9 |
5.9 |
6.0 |
3.7 |
3.7 |
3.6 |
2.6 |
2.4 |
3.2 |
|
|
0.8 |
0.7 |
1.2 |
3.6 |
3.5 |
3.9 |
4.2 |
4.1 |
4.7 |
|
|
10.4 |
10.3 |
10.8 |
7.8 |
7.8 |
7.9 |
5.5 |
5.5 |
5.6 |
|
|
9.9 |
10.0 |
9.8 |
5.4 |
5.4 |
5.4 |
4.9 |
4.9 |
4.8 |
|
|
6.3 |
6.3 |
7.0 |
-2.4 |
-2.4 |
-2.5 |
-3.0 |
-3.0 |
-2.6 |
|
|
12.0 |
12.1 |
11.3 |
2.1 |
2.1 |
2.2 |
7.4 |
7.4 |
7.6 |
|
|
13.4 |
13.3 |
13.8 |
7.6 |
7.5 |
7.8 |
-0.5 |
-0.5 |
-0.5 |
|
|
5.2 |
5.0 |
6.4 |
4.5 |
4.1 |
6.4 |
4.8 |
4.5 |
6.3 |
|
|
4.3 |
4.1 |
4.6 |
3.6 |
3.7 |
3.5 |
2.8 |
3.1 |
2.3 |
|
|
6.2 |
6.5 |
4.9 |
1.5 |
1.5 |
0.9 |
3.0 |
3.2 |
2.3 |
|
|
14.3 |
14.3 |
14.5 |
6.2 |
6.0 |
6.8 |
5.2 |
5.1 |
5.9 |
|
|
Nominal hourly labour costs of Industry (NACE Rev. 2 sections B to E) % change compared with same quarter of previous year – calendar adjusted |
|||||||||
|---|---|---|---|---|---|---|---|---|---|
|
Q2 2025 |
Q1 2026 |
Q2 2026 |
|||||||
|
TOTAL |
WAGES |
OTHER |
TOTAL |
WAGES |
OTHER |
TOTAL |
WAGES |
OTHER |
|
|
3.7 |
3.5 |
4.0 |
3.2 |
3.4 |
2.9 |
2.9 |
2.8 |
3.0 |
|
|
4.2 |
4.2 |
4.5 |
3.5 |
3.7 |
3.2 |
3.0 |
3.0 |
3.0 |
|
|
3.8 |
3.8 |
3.7 |
: |
: |
: |
: |
: |
: |
|
|
14.1 |
14.3 |
13.3 |
14.1 |
14.0 |
14.6 |
12.2 |
11.9 |
13.9 |
|
|
6.4 |
6.4 |
6.4 |
4.6 |
4.6 |
4.5 |
4.2 |
4.2 |
4.2 |
|
|
2.5 |
1.5 |
8.6 |
3.0 |
1.9 |
9.6 |
2.6 |
2.8 |
1.2 |
|
|
3.1 |
3.2 |
2.7 |
2.8 |
3.2 |
1.6 |
2.8 |
2.7 |
3.1 |
|
|
10.1 |
9.9 |
10.5 |
6.6 |
6.3 |
7.4 |
4.9 |
4.6 |
5.7 |
|
|
2.0 |
2.5 |
-0.5 |
3.0 |
2.3 |
6.7 |
3.8 |
4.5 |
-0.1 |
|
|
11.1 |
11.2 |
10.7 |
6.6 |
6.5 |
7.2 |
5.7 |
5.9 |
4.9 |
|
|
4.1 |
2.9 |
7.6 |
3.5 |
3.6 |
3.3 |
2.6 |
2.9 |
1.5 |
|
|
2.4 |
2.2 |
3.1 |
2.3 |
2.1 |
2.5 |
2.2 |
1.9 |
2.8 |
|
|
12.1 |
11.9 |
13.9 |
11.4 |
11.0 |
13.9 |
10.4 |
10.1 |
12.8 |
|
|
3.7 |
3.3 |
4.7 |
2.8 |
2.6 |
3.4 |
2.7 |
2.6 |
2.9 |
|
|
4.0 |
3.9 |
4.5 |
4.4 |
4.5 |
3.9 |
4.9 |
5.0 |
4.4 |
|
|
9.1 |
9.1 |
9.0 |
4.3 |
4.5 |
3.5 |
5.1 |
4.9 |
5.9 |
|
|
9.2 |
9.3 |
:c |
9.0 |
9.1 |
:c |
9.4 |
9.3 |
:c |
|
|
1.4 |
1.4 |
1.6 |
3.3 |
3.0 |
6.4 |
3.7 |
3.4 |
6.3 |
|
|
9.2 |
9.2 |
9.8 |
6.3 |
6.4 |
5.7 |
6.4 |
6.5 |
5.8 |
|
|
8.5 |
8.8 |
4.6 |
5.0 |
3.8 |
22.7 |
8.7 |
8.4 |
12.5 |
|
|
7.0 |
6.8 |
7.6 |
5.6 |
5.2 |
6.8 |
:c |
:c |
:c |
|
|
3.5 |
3.4 |
4.0 |
1.8 |
1.7 |
2.5 |
1.7 |
1.7 |
1.8 |
|
|
10.3 |
10.3 |
10.4 |
6.5 |
6.5 |
6.6 |
3.7 |
3.7 |
3.7 |
|
|
2.7 |
2.7 |
2.8 |
6.2 |
6.2 |
6.2 |
5.1 |
5.2 |
4.8 |
|
|
12.6 |
12.6 |
12.6 |
6.2 |
6.2 |
6.2 |
3.6 |
3.6 |
3.4 |
|
|
5.4 |
5.5 |
4.8 |
3.9 |
4.2 |
2.0 |
6.4 |
6.4 |
6.8 |
|
|
9.6 |
9.4 |
10.0 |
5.2 |
5.1 |
5.4 |
4.2 |
4.0 |
4.8 |
|
|
3.0 |
2.5 |
5.4 |
3.5 |
3.1 |
5.6 |
3.3 |
3.2 |
3.9 |
|
|
4.8 |
4.5 |
5.6 |
3.2 |
3.6 |
2.2 |
3.1 |
3.8 |
1.7 |
|
|
7.8 |
9.7 |
-0.8 |
4.4 |
4.3 |
3.7 |
4.4 |
4.7 |
4.9 |
|
|
13.2 |
13.1 |
13.5 |
5.2 |
5.1 |
5.6 |
5.9 |
5.8 |
6.2 |
|
|
Nominal hourly labour costs of Construction (NACE Rev. 2 section F) % change compared with same quarter of previous year – calendar adjusted |
|||||||||
|---|---|---|---|---|---|---|---|---|---|
|
Q2 2025 |
Q1 2026 |
Q2 2026 |
|||||||
|
TOTAL |
WAGES |
OTHER |
TOTAL |
WAGES |
OTHER |
TOTAL |
WAGES |
OTHER |
|
|
5.0 |
4.6 |
6.0 |
4.0 |
4.1 |
3.7 |
3.9 |
4.1 |
3.5 |
|
|
5.2 |
4.9 |
6.0 |
4.1 |
4.3 |
3.7 |
3.9 |
4.1 |
3.3 |
|
|
3.6 |
3.6 |
3.6 |
: |
: |
: |
: |
: |
: |
|
|
16.1 |
16.1 |
15.8 |
11.7 |
11.4 |
13.6 |
8.5 |
8.7 |
7.4 |
|
|
10.3 |
10.2 |
10.4 |
6.3 |
6.3 |
6.1 |
6.7 |
6.7 |
6.5 |
|
|
-0.3 |
-1.1 |
5.3 |
3.1 |
2.4 |
7.6 |
3.9 |
3.9 |
3.3 |
|
|
4.3 |
4.2 |
4.8 |
3.7 |
4.0 |
2.8 |
5.2 |
5.4 |
4.5 |
|
|
13.3 |
13.1 |
13.7 |
8.3 |
8.3 |
8.2 |
5.9 |
5.4 |
7.5 |
|
|
:c |
7.0 |
:c |
:c |
4.6 |
:c |
:c |
3.0 |
:c |
|
|
11.8 |
8.1 |
24.5 |
13.9 |
11.7 |
22.7 |
9.5 |
9.7 |
9.2 |
|
|
4.6 |
4.6 |
4.7 |
7.4 |
7.9 |
6.5 |
5.4 |
5.1 |
6.2 |
|
|
2.8 |
2.4 |
4.0 |
1.7 |
2.2 |
0.3 |
1.6 |
2.3 |
-0.1 |
|
|
11.6 |
11.3 |
13.4 |
14.5 |
13.9 |
18.0 |
13.4 |
12.8 |
17.0 |
|
|
5.7 |
4.7 |
8.1 |
4.0 |
3.9 |
4.3 |
1.7 |
1.6 |
2.1 |
|
|
5.5 |
5.5 |
5.6 |
4.6 |
4.6 |
4.4 |
5.4 |
5.5 |
5.2 |
|
|
10.0 |
9.9 |
10.8 |
1.2 |
1.1 |
1.6 |
-3.8 |
-4.0 |
-3.3 |
|
|
8.1 |
8.1 |
9.0 |
6.3 |
6.4 |
2.6 |
9.9 |
9.9 |
8.6 |
|
|
2.8 |
2.9 |
2.1 |
3.1 |
2.7 |
6.5 |
3.9 |
3.5 |
6.9 |
|
|
11.3 |
11.4 |
10.7 |
9.4 |
9.5 |
8.2 |
7.8 |
8.0 |
6.5 |
|
|
-1.9 |
-1.9 |
-2.2 |
0.2 |
0.4 |
-3.9 |
-1.1 |
-0.9 |
-3.8 |
|
|
9.0 |
8.8 |
9.7 |
4.8 |
4.5 |
6.0 |
:c |
:c |
:c |
|
|
5.6 |
4.5 |
9.2 |
3.3 |
2.8 |
4.8 |
3.3 |
2.8 |
4.9 |
|
|
4.6 |
4.6 |
4.6 |
7.6 |
7.6 |
7.6 |
5.0 |
5.0 |
5.0 |
|
|
3.6 |
3.6 |
3.6 |
7.1 |
7.1 |
7.1 |
6.7 |
6.7 |
6.6 |
|
|
15.0 |
15.0 |
14.7 |
7.4 |
7.4 |
7.4 |
5.7 |
5.7 |
5.8 |
|
|
7.1 |
6.9 |
8.3 |
4.0 |
4.4 |
1.7 |
7.9 |
8.3 |
5.7 |
|
|
5.8 |
5.7 |
6.0 |
6.5 |
6.5 |
6.4 |
2.8 |
2.8 |
2.9 |
|
|
4.5 |
4.2 |
5.9 |
2.9 |
2.9 |
3.0 |
-0.8 |
-0.9 |
-0.2 |
|
|
5.3 |
5.3 |
5.3 |
1.6 |
1.9 |
1.0 |
0.9 |
1.4 |
-0.3 |
|
|
8.9 |
9.4 |
6.8 |
2.7 |
2.5 |
2.6 |
3.4 |
3.4 |
4.4 |
|
|
13.2 |
13.1 |
13.5 |
6.8 |
6.7 |
7.2 |
7.7 |
7.6 |
8.2 |
|
|
Nominal hourly labour costs of Services (NACE Rev. 2 sections G to N) % change compared with same quarter of previous year – calendar adjusted |
|||||||||
|---|---|---|---|---|---|---|---|---|---|
|
Q2 2025 |
Q1 2026 |
Q2 2026 |
|||||||
|
TOTAL |
WAGES |
OTHER |
TOTAL |
WAGES |
OTHER |
TOTAL |
WAGES |
OTHER |
|
|
4.8 |
4.8 |
4.8 |
3.2 |
3.3 |
3.0 |
3.0 |
2.9 |
3.3 |
|
|
5.0 |
5.0 |
5.0 |
3.4 |
3.5 |
3.1 |
3.1 |
3.1 |
3.2 |
|
|
3.4 |
3.4 |
3.4 |
: |
: |
: |
: |
: |
: |
|
|
11.9 |
12.0 |
11.3 |
12.5 |
12.4 |
13.3 |
11.5 |
11.5 |
11.8 |
|
|
7.2 |
7.1 |
7.4 |
5.8 |
5.8 |
5.7 |
6.0 |
6.0 |
6.1 |
|
|
2.6 |
2.3 |
4.0 |
2.9 |
2.6 |
4.2 |
2.8 |
2.8 |
2.3 |
|
|
5.8 |
6.0 |
4.9 |
2.6 |
3.0 |
1.1 |
2.7 |
2.7 |
2.7 |
|
|
12.5 |
12.5 |
12.5 |
4.3 |
4.3 |
4.4 |
4.9 |
5.0 |
4.6 |
|
|
3.1 |
3.1 |
3.2 |
3.5 |
2.4 |
10.8 |
4.4 |
4.1 |
6.1 |
|
|
9.9 |
10.8 |
6.2 |
7.0 |
7.5 |
4.6 |
6.0 |
6.0 |
5.8 |
|
|
4.2 |
3.9 |
4.9 |
4.2 |
3.9 |
5.1 |
3.9 |
3.4 |
5.1 |
|
|
2.2 |
2.0 |
2.8 |
2.4 |
2.3 |
2.8 |
2.6 |
2.5 |
2.9 |
|
|
10.7 |
10.5 |
12.2 |
10.7 |
10.2 |
13.8 |
10.3 |
9.8 |
13.7 |
|
|
4.5 |
4.0 |
5.9 |
3.1 |
3.0 |
3.4 |
1.6 |
1.4 |
2.1 |
|
|
3.9 |
3.9 |
3.9 |
4.4 |
4.4 |
4.6 |
4.1 |
4.1 |
4.2 |
|
|
8.3 |
8.0 |
9.5 |
3.3 |
3.6 |
2.0 |
6.8 |
6.1 |
9.7 |
|
|
8.1 |
8.2 |
5.9 |
7.8 |
7.9 |
4.1 |
10.0 |
10.0 |
9.4 |
|
|
1.1 |
1.0 |
1.5 |
4.3 |
4.0 |
7.3 |
2.4 |
1.9 |
6.7 |
|
|
9.6 |
9.6 |
9.8 |
8.6 |
8.9 |
7.0 |
8.4 |
8.5 |
7.6 |
|
|
0.6 |
0.6 |
0.6 |
1.8 |
1.7 |
3.2 |
3.0 |
3.1 |
0.9 |
|
|
7.1 |
6.9 |
7.9 |
3.7 |
3.7 |
3.5 |
:c |
:c |
:c |
|
|
5.4 |
5.2 |
6.0 |
4.9 |
4.8 |
5.4 |
4.3 |
4.1 |
4.9 |
|
|
9.4 |
9.4 |
9.6 |
7.2 |
7.2 |
7.2 |
5.0 |
5.0 |
4.9 |
|
|
3.3 |
3.3 |
3.5 |
4.5 |
4.5 |
4.5 |
5.7 |
5.8 |
5.5 |
|
|
10.5 |
10.5 |
10.5 |
5.2 |
5.2 |
4.7 |
2.8 |
2.8 |
2.8 |
|
|
5.7 |
5.7 |
5.6 |
4.0 |
4.0 |
3.8 |
6.8 |
6.6 |
7.8 |
|
|
7.2 |
6.9 |
8.0 |
4.2 |
3.9 |
5.0 |
4.8 |
4.6 |
5.3 |
|
|
4.8 |
4.5 |
6.1 |
3.9 |
3.9 |
4.2 |
2.8 |
2.8 |
3.2 |
|
|
5.3 |
4.8 |
6.4 |
2.4 |
2.9 |
1.5 |
2.4 |
3.2 |
0.8 |
|
|
7.6 |
9.1 |
-0.1 |
2.9 |
6.5 |
-13.4 |
6.2 |
6.1 |
8.3 |
|
|
11.0 |
10.9 |
11.5 |
6.4 |
6.3 |
6.7 |
6.2 |
6.1 |
6.5 |
|
|
Nominal hourly labour costs of wage and non-wage component by NACE Rev. 2 sections in the EU % change compared with the same quarter of the previous year – calendar adjusted |
|||||||||
|---|---|---|---|---|---|---|---|---|---|
|
Q2 2025 |
Q1 2026 |
Q2 2026 |
|||||||
|
TOTAL |
WAGES |
OTHER |
TOTAL |
WAGES |
OTHER |
TOTAL |
WAGES |
OTHER |
|
|
7.6 |
7.4 |
8.0 |
5.6 |
5.6 |
5.5 |
1.3 |
1.5 |
0.7 |
|
|
4.2 |
4.1 |
4.5 |
3.5 |
3.6 |
3.1 |
3.0 |
3.0 |
3.1 |
|
|
3.2 |
3.4 |
2.8 |
4.3 |
4.7 |
2.9 |
2.2 |
2.4 |
1.7 |
|
|
4.8 |
4.7 |
5.2 |
3.7 |
3.8 |
3.2 |
3.4 |
3.7 |
2.7 |
|
|
5.2 |
4.9 |
6.0 |
4.1 |
4.3 |
3.7 |
3.9 |
4.1 |
3.3 |
|
|
4.0 |
3.9 |
4.4 |
4.1 |
4.4 |
2.9 |
3.5 |
3.6 |
3.0 |
|
|
4.4 |
4.5 |
4.3 |
4.0 |
4.1 |
3.5 |
3.6 |
3.7 |
3.3 |
|
|
4.0 |
3.8 |
4.7 |
2.5 |
2.6 |
2.0 |
3.1 |
3.1 |
2.9 |
|
|
4.2 |
4.0 |
4.8 |
4.3 |
4.2 |
4.5 |
4.4 |
4.5 |
4.2 |
|
|
4.9 |
5.0 |
4.7 |
3.5 |
3.7 |
2.9 |
3.2 |
3.2 |
3.3 |
|
|
2.2 |
1.8 |
3.6 |
4.5 |
4.6 |
4.0 |
5.5 |
5.7 |
4.9 |
|
|
9.0 |
9.3 |
7.8 |
1.2 |
1.0 |
1.7 |
0.1 |
-0.4 |
1.6 |
|
|
4.2 |
4.2 |
4.3 |
4.0 |
3.9 |
4.2 |
4.8 |
4.8 |
4.8 |
|
|
3.3 |
3.2 |
3.5 |
3.3 |
3.6 |
2.6 |
2.1 |
2.0 |
2.2 |
|
|
3.7 |
3.9 |
3.1 |
3.9 |
4.3 |
2.9 |
3.4 |
3.6 |
3.0 |
|
|
3.9 |
3.8 |
3.9 |
3.8 |
4.0 |
3.1 |
4.0 |
3.9 |
4.1 |
|
|
3.5 |
3.5 |
3.7 |
2.5 |
2.8 |
1.5 |
1.9 |
1.7 |
2.5 |
|
|
4.3 |
4.2 |
4.4 |
4.5 |
4.7 |
3.6 |
5.2 |
5.1 |
5.7 |
|
Notes for users
Revisions and timetable
The Labour Cost Index data are subject to revision, in particular for the latest quarters, when new source data become available. The original data, before any subsequent revision, are also available here.
Compared with the News Release of 16 June 2026, the annual growth rate of the hourly labour costs for the total economy in the first quarter of 2026 was revised from 3.2% to 3.3% for the euro area and from 3.6% to 3.5% for the EU.
Eurostat releases early estimates for the hourly labour costs of the euro area and of the EU, around 50 days after the reference quarter. Early estimates for the second quarter of 2026 have been released on 19 August 2026 and early estimates for the third quarter of 2026 are scheduled on 19 November 2026.
Country notes
At the time of finalizing this publication, data from Belgium were not available for the last four reference quarters (Q3 2025, Q4 2025, Q1 2026 and Q2 2026).
Methods and definitions
The Labour Cost Index is a short-term indicator showing the development of hourly labour costs incurred by employers, in nominal terms, that is without adjusting for price developments. It is calculated dividing the labour cost in national currency by the number of hours worked. Therefore, the development of variables, labour costs and hours worked, affect the evolution of the index (base year = 2020).
The quarterly changes in hourly employers’ costs are measured for total labour costs and its main components: wages and salaries; and non-wage costs (labour costs other than wages and salaries). Total labour costs (TOT) cover wage and non-wage costs less subsidies. They do not include vocational training costs or other expenditures such as recruitment costs, spending on working clothes, etc.
Wage and salary costs (WAG) include direct remuneration, bonuses, and allowances paid by an employer in cash or in kind to an employee in return for work done, payments to employees saving schemes, payments for days not worked and remuneration in kind such as food, drink, fuel, company cars, etc.
Labour costs other than wages and salaries (OTH – non-wage costs) include the employers’ social contributions plus employment taxes regarded as labour costs less subsidies intended to refund part or the entire employer’s cost of direct remuneration.
Eurostat publishes Labour Cost Index data for NACE Rev. 2 sections B to S. The aggregate is referred to as “Whole economy” for the sake of simplification, although sections A: ‘Agriculture, forestry and fishing’; T: ‘Activities of households as employers; undifferentiated goods and services producing activities of households for own use’ and U: ‘Activities of extraterritorial organisations and bodies’ are excluded. Section N: ‘Administrative and support service activities’ includes the activities of temporary employment agencies.
Geographical information
Euro area includes Belgium, Bulgaria, Germany, Estonia, Ireland, Greece, Spain, France, Croatia, Italy, Cyprus, Latvia, Lithuania, Luxembourg, Malta, the Netherlands, Austria, Portugal, Slovenia, Slovakia and Finland (EA21).
The European Union includes Belgium, Bulgaria, Czechia, Denmark, Germany, Estonia, Ireland, Greece, Spain, France, Croatia, Italy, Cyprus, Latvia, Lithuania, Luxembourg, Hungary, Malta, the Netherlands, Austria, Poland, Portugal, Romania, Slovenia, Slovakia, Finland and Sweden (EU27).