Overview
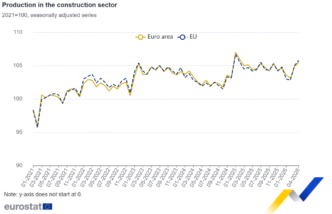
In April 2026, compared with March 2026, seasonally adjusted production in construction increased by 0.6% in the euro area and by 0.8% in the EU, according to first estimates from Eurostat, the statistical office of the European Union. In March 2026, production in construction grew by 1.7% in the euro area and by 2.1% in the EU.
In April 2026, compared with April 2025, production in construction increased by 0.9% in the euro area and by 1.5% in the EU.

Monthly comparison by construction sector and by Member State
In the euro area in April 2026, compared with March 2026, production in construction
-
decreased by 0.1% for construction of buildings,
-
increased by 0.8% for civil engineering,
-
increased by 0.8% for specialised construction activities.
In the EU, production in construction
-
decreased by 0.3% for construction of buildings,
-
increased by 1.2% for civil engineering,
-
increased by 0.7% for specialised construction activities.
Among Member States for which data are available, the highest monthly increases in production in construction were recorded in Romania (+10.3%), Hungary (+6.9%) and Slovenia (+3.6%). The largest decreases were observed in Slovakia (-6.7%), the Netherlands (-2.2%) and Belgium (-1.6%).
Annual comparison by construction sector and by Member State
In the euro area in April 2026, compared with April 2025, production in construction
-
decreased by 5.2% for construction of buildings,
-
increased by 4.4% for civil engineering,
-
increased by 1.7% for specialised construction activities.
In the EU, production in construction
-
decreased by 3.2% for construction of buildings,
-
increased by 4.1% for civil engineering,
-
increased by 1.8% for specialised construction activities.
Among Member States for which data are available, the highest annual increases in production in construction were recorded in Slovenia (+31.6%), Romania (+23.8%) and Slovakia (+14.5%). Decreases were observed in Belgium (-3.8%), the Netherlands (-3.3%) and France (-2.9%).
Tables
|
Production in construction % change compared with the previous month* |
||||||
|---|---|---|---|---|---|---|
|
Nov-25 |
Dec-25 |
Jan-26 |
Feb-26 |
Mar-26 |
Apr-26 |
|
|
-0.9 |
0.3 |
-1.0 |
-0.5 |
1.7 |
0.6 |
|
|
-1.5 |
0.4 |
-4.1 |
-0.2 |
1.8 |
-0.1 |
|
|
-0.7 |
0.9 |
-3.7 |
-0.8 |
6.7 |
0.8 |
|
|
-1.1 |
0.5 |
-0.5 |
-0.6 |
1.7 |
0.8 |
|
|
-1.0 |
0.6 |
-1.7 |
-0.2 |
2.1 |
0.8 |
|
|
-1.5 |
0.8 |
-5.1 |
0.4 |
2.3 |
-0.3 |
|
|
-1.6 |
1.1 |
-4.1 |
0.2 |
5.8 |
1.2 |
|
|
-0.8 |
0.8 |
-1.3 |
-0.6 |
2.1 |
0.7 |
|
|
Production in construction % change compared with the previous month* |
||||||
|---|---|---|---|---|---|---|
|
Nov-25 |
Dec-25 |
Jan-26 |
Feb-26 |
Mar-26 |
Apr-26 |
|
|
-0.9 |
0.3 |
-1.0 |
-0.5 |
1.7 |
0.6 |
|
|
-1.0 |
0.6 |
-1.7 |
-0.2 |
2.1 |
0.8 |
|
|
0.0 |
0.1 |
2.7 |
-1.4 |
0.6 |
-1.6 |
|
|
1.1 |
2.7 |
-1.7 |
4.0 |
-0.2 |
-0.1 |
|
|
0.0 |
1.8 |
-2.2 |
1.5 |
4.5 |
-1.0 |
|
|
-0.1 |
-1.3 |
-1.4 |
1.2 |
1.4 |
-0.1 |
|
|
-1.0 |
1.7 |
-1.1 |
-1.7 |
3.6 |
2.4 |
|
|
: |
: |
: |
: |
: |
: |
|
|
c |
c |
c |
c |
c |
c |
|
|
: |
: |
: |
: |
: |
: |
|
|
-3.2 |
-2.0 |
-3.3 |
1.1 |
2.4 |
0.9 |
|
|
-0.8 |
1.7 |
-1.0 |
-1.4 |
-0.2 |
0.0 |
|
|
0.1 |
1.2 |
-2.7 |
1.6 |
0.9 |
: |
|
|
-0.1 |
-0.8 |
-1.0 |
c |
c |
c |
|
|
: |
: |
: |
: |
: |
: |
|
|
: |
: |
: |
: |
: |
: |
|
|
: |
: |
: |
: |
: |
: |
|
|
1.0 |
-1.7 |
2.3 |
-1.4 |
0.8 |
: |
|
|
-8.8 |
9.1 |
-14.3 |
11.5 |
0.6 |
6.9 |
|
|
: |
: |
: |
: |
: |
: |
|
|
-1.3 |
-0.5 |
-1.0 |
0.1 |
0.5 |
-2.2 |
|
|
-0.6 |
-1.1 |
-1.9 |
0.9 |
3.7 |
0.1 |
|
|
-1.0 |
4.5 |
-9.8 |
-2.6 |
7.2 |
3.4 |
|
|
-3.5 |
-0.9 |
-0.3 |
1.2 |
0.6 |
0.2 |
|
|
-6.1 |
7.2 |
-4.5 |
7.7 |
-0.6 |
10.3 |
|
|
-7.2 |
-3.7 |
-2.2 |
5.4 |
5.6 |
3.6 |
|
|
3.9 |
3.1 |
-5.4 |
5.5 |
11.8 |
-6.7 |
|
|
1.6 |
-0.8 |
0.4 |
1.2 |
0.9 |
0.6 |
|
|
0.0 |
0.0 |
-4.8 |
1.5 |
3.6 |
-1.0 |
|
|
0.0 |
-0.7 |
0.9 |
-1.3 |
0.4 |
-0.6 |
|
|
Production in construction % change compared with the same month of the previous year* |
||||||
|---|---|---|---|---|---|---|
|
Nov-25 |
Dec-25 |
Jan-26 |
Feb-26 |
Mar-26 |
Apr-26 |
|
|
0.8 |
0.8 |
-5.0 |
-3.4 |
0.2 |
0.9 |
|
|
-3.4 |
-4.0 |
-14.7 |
-11.4 |
-7.1 |
-5.2 |
|
|
0.0 |
1.7 |
-3.3 |
-2.5 |
5.3 |
4.4 |
|
|
0.9 |
1.8 |
-2.2 |
-1.6 |
0.6 |
1.7 |
|
|
0.8 |
1.3 |
-5.0 |
-3.3 |
0.6 |
1.5 |
|
|
-1.2 |
-1.2 |
-13.8 |
-10.0 |
-5.1 |
-3.2 |
|
|
-1.4 |
1.3 |
-3.9 |
-3.1 |
4.7 |
4.1 |
|
|
1.4 |
2.6 |
-2.2 |
-1.8 |
0.9 |
1.8 |
|
|
Production in construction % change compared with the same month of the previous year* |
||||||
|---|---|---|---|---|---|---|
|
Nov-25 |
Dec-25 |
Jan-26 |
Feb-26 |
Mar-26 |
Apr-26 |
|
|
0.8 |
0.8 |
-5.0 |
-3.4 |
0.2 |
0.9 |
|
|
0.8 |
1.3 |
-5.0 |
-3.3 |
0.6 |
1.5 |
|
|
-4.4 |
-3.8 |
3.3 |
0.2 |
3.4 |
-3.8 |
|
|
3.0 |
8.9 |
2.8 |
9.7 |
6.4 |
6.7 |
|
|
7.8 |
6.9 |
0.5 |
2.8 |
6.4 |
7.7 |
|
|
3.2 |
2.5 |
0.8 |
-0.6 |
2.2 |
1.6 |
|
|
-2.6 |
-0.6 |
-7.4 |
-4.2 |
0.4 |
2.6 |
|
|
: |
: |
: |
: |
: |
: |
|
|
c |
c |
c |
c |
c |
c |
|
|
: |
: |
: |
: |
: |
: |
|
|
20.2 |
8.6 |
-24.7 |
-18.4 |
-5.9 |
1.4 |
|
|
-4.1 |
-3.8 |
-1.0 |
-3.4 |
-3.3 |
-2.9 |
|
|
7.2 |
7.9 |
0.2 |
3.4 |
4.2 |
: |
|
|
2.2 |
5.0 |
-0.4 |
c |
c |
c |
|
|
: |
: |
: |
: |
: |
: |
|
|
: |
: |
: |
: |
: |
: |
|
|
: |
: |
: |
: |
: |
: |
|
|
4.4 |
-0.1 |
4.8 |
1.6 |
3.4 |
: |
|
|
-4.1 |
6.6 |
-17.8 |
-0.9 |
2.0 |
2.5 |
|
|
: |
: |
: |
: |
: |
: |
|
|
0.8 |
0.7 |
-1.9 |
-0.1 |
2.3 |
-3.3 |
|
|
-3.3 |
-5.4 |
-8.2 |
-5.0 |
-0.7 |
1.6 |
|
|
0.1 |
2.9 |
-11.0 |
-13.7 |
-1.6 |
4.5 |
|
|
3.9 |
-2.3 |
2.6 |
0.3 |
6.5 |
2.6 |
|
|
-1.8 |
5.4 |
-2.7 |
14.0 |
8.3 |
23.8 |
|
|
10.7 |
8.8 |
8.2 |
22.5 |
33.6 |
31.6 |
|
|
3.6 |
9.2 |
-0.6 |
7.6 |
27.8 |
14.5 |
|
|
11.1 |
5.4 |
4.1 |
7.1 |
6.7 |
7.7 |
|
|
2.0 |
2.0 |
-1.7 |
-0.1 |
4.6 |
2.3 |
|
|
-0.9 |
-0.9 |
-0.6 |
-2.2 |
-1.5 |
-2.4 |
|
|
Monthly indices for production in construction, calendar and seasonally adjusted (base year 2021) |
||||||
|---|---|---|---|---|---|---|
|
Nov-25 |
Dec-25 |
Jan-26 |
Feb-26 |
Mar-26 |
Apr-26 |
|
|
104.3 |
104.6 |
103.6 |
103.1 |
104.9 |
105.5 |
|
|
104.2 |
104.8 |
103.0 |
102.8 |
105.0 |
105.8 |
|
|
100.5 |
100.6 |
103.3 |
101.9 |
102.5 |
100.9 |
|
|
111.3 |
114.3 |
112.3 |
116.8 |
116.6 |
116.5 |
|
|
110.4 |
112.4 |
109.9 |
111.6 |
116.6 |
115.4 |
|
|
109.0 |
107.6 |
106.1 |
107.4 |
108.9 |
108.8 |
|
|
89.4 |
90.9 |
89.9 |
88.4 |
91.6 |
93.8 |
|
|
: |
: |
: |
: |
: |
: |
|
|
c |
c |
c |
c |
c |
c |
|
|
: |
: |
: |
: |
: |
: |
|
|
119.3 |
116.9 |
113.1 |
114.4 |
117.2 |
118.2 |
|
|
90.2 |
91.7 |
90.8 |
89.5 |
89.3 |
89.3 |
|
|
136.1 |
137.7 |
134.0 |
136.1 |
137.3 |
: |
|
|
142.4 |
141.2 |
139.8 |
c |
c |
c |
|
|
: |
: |
: |
: |
: |
: |
|
|
: |
: |
: |
: |
: |
: |
|
|
: |
: |
: |
: |
: |
: |
|
|
98.4 |
96.7 |
98.9 |
97.5 |
98.3 |
: |
|
|
91.9 |
100.3 |
86.0 |
95.9 |
96.5 |
103.2 |
|
|
: |
: |
: |
: |
: |
: |
|
|
108.8 |
108.3 |
107.2 |
107.3 |
107.8 |
105.4 |
|
|
96.6 |
95.5 |
93.7 |
94.5 |
98.0 |
98.1 |
|
|
104.7 |
109.4 |
98.7 |
96.1 |
103.0 |
106.5 |
|
|
114.3 |
113.3 |
113.0 |
114.3 |
115.0 |
115.2 |
|
|
127.0 |
136.2 |
130.1 |
140.1 |
139.2 |
153.5 |
|
|
157.5 |
151.7 |
148.3 |
156.3 |
165.0 |
170.9 |
|
|
85.8 |
88.5 |
83.7 |
88.3 |
98.7 |
92.1 |
|
|
100.8 |
100.0 |
100.4 |
101.6 |
102.5 |
103.1 |
|
|
91.9 |
91.9 |
87.5 |
88.8 |
92.0 |
91.1 |
|
|
97.9 |
97.2 |
98.1 |
96.8 |
97.2 |
96.6 |
|
|
Monthly indices for production in construction, calendar adjusted (base year 2021) |
||||||
|---|---|---|---|---|---|---|
|
Nov-25 |
Dec-25 |
Jan-26 |
Feb-26 |
Mar-26 |
Apr-26 |
|
|
112.5 |
103.2 |
87.2 |
96.6 |
111.0 |
105.8 |
|
|
113.8 |
108.7 |
84.2 |
93.6 |
108.9 |
105.0 |
|
|
100.5 |
80.3 |
101.4 |
104.6 |
116.4 |
101.5 |
|
|
113.1 |
103.5 |
109.5 |
113.2 |
122.6 |
115.3 |
|
|
134.5 |
118.9 |
60.1 |
70.6 |
102.7 |
108.2 |
|
|
118.0 |
100.7 |
99.6 |
104.5 |
114.0 |
104.2 |
|
|
98.8 |
100.4 |
60.2 |
72.4 |
95.1 |
94.4 |
|
|
: |
: |
: |
: |
: |
: |
|
|
c |
c |
c |
c |
c |
c |
|
|
: |
: |
: |
: |
: |
: |
|
|
126.1 |
144.3 |
92.4 |
98.8 |
116.5 |
116.2 |
|
|
98.6 |
80.3 |
87.9 |
92.6 |
95.1 |
91.0 |
|
|
133.7 |
126.6 |
127.1 |
136.3 |
148.6 |
: |
|
|
151.2 |
125.6 |
127.6 |
c |
c |
c |
|
|
: |
: |
: |
: |
: |
: |
|
|
: |
: |
: |
: |
: |
: |
|
|
: |
: |
: |
: |
: |
: |
|
|
106.7 |
82.8 |
88.8 |
99.7 |
108.0 |
: |
|
|
107.2 |
140.3 |
49.1 |
65.3 |
91.7 |
92.7 |
|
|
: |
: |
: |
: |
: |
: |
|
|
108.9 |
84.0 |
108.9 |
121.0 |
127.1 |
112.8 |
|
|
115.5 |
114.6 |
55.9 |
68.9 |
95.7 |
93.7 |
|
|
126.4 |
168.6 |
59.6 |
62.5 |
85.6 |
93.3 |
|
|
116.2 |
104.1 |
112.6 |
112.0 |
121.3 |
114.0 |
|
|
150.5 |
208.4 |
65.8 |
92.0 |
122.4 |
141.9 |
|
|
190.3 |
141.3 |
109.2 |
131.2 |
159.1 |
162.8 |
|
|
107.1 |
104.3 |
52.7 |
65.5 |
85.1 |
82.3 |
|
|
108.9 |
115.7 |
71.4 |
79.6 |
93.0 |
92.5 |
|
|
108.0 |
117.8 |
65.0 |
75.8 |
88.8 |
89.6 |
|
|
113.2 |
91.4 |
104.4 |
90.5 |
98.8 |
88.5 |
|
Notes for users
Revisions and timetable
Compared with the data issued in the News Release of 21 May 2026, the monthly percentage change for March 2026 has been revised from +0.8% to +1.7% in the euro area and from +1.2% to +2.1% in the EU. The annual percentage change has been revised from -1.2% to +0.2% in the euro area and from -0.6% to +0.6% in the EU.
Methods and definitions
The index of production in construction approximates the evolution of the volume of production within the sector, broken down into construction of buildings, civil engineering and specialised construction activities according to NACE Rev. 2 activity classification.
Seasonally adjusted euro area and EU series are calculated by aggregating the seasonally adjusted national data. Eurostat carries out the seasonal adjustment of the data for those countries that do not adjust their data for seasonal effects.
The monthly index as presented in this News Release is calculated only on the basis of the data of those countries reporting monthly data. Missing observations from Member States for recent months are estimated for the calculation of the euro area and the EU aggregates.
Geographical information
Euro area (EA21) includes Belgium, Bulgaria, Germany, Estonia, Ireland, Greece, Spain, France, Croatia, Italy, Cyprus, Latvia, Lithuania, Luxembourg, Malta, the Netherlands, Austria, Portugal, Slovenia, Slovakia and Finland.
The European Union (EU27) includes Belgium, Bulgaria, Czechia, Denmark, Germany, Estonia, Ireland, Greece, Spain, France, Croatia, Italy, Cyprus, Latvia, Lithuania, Luxembourg, Hungary, Malta, the Netherlands, Austria, Poland, Portugal, Romania, Slovenia, Slovakia, Finland and Sweden.
Estonia, Greece, Croatia, Cyprus, Latvia, Lithuania, Luxembourg and Malta are not required to supply monthly data within 1 month and 15 days after the end of the reference month under Regulation (EU) 2019/2152.