Overview
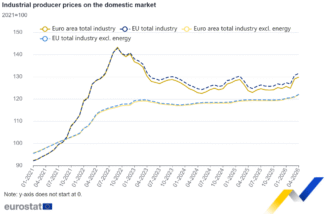
In April 2026, compared with March 2026, industrial producer prices increased by 0.6% in the euro area and by 0.7% in the EU, according to first estimates from Eurostat, the statistical office of the European Union. In March 2026, industrial producer prices grew by 3.4% in the euro area and by 3.1% in the EU.
In April 2026, compared with April 2025, industrial producer prices increased by 4.9% in both the euro area and the EU.

Monthly comparison by main industrial grouping and by Member State
In the euro area in April 2026, compared with March 2026, industrial producer prices
-
increased by 1.8% for intermediate goods,
-
decreased by 0.4% for energy,
-
increased by 0.3% for capital goods,
-
increased by 0.3% for durable consumer goods,
-
remained stable for non-durable consumer goods.
Prices in total industry excluding energy increased by 0.9%.
In the EU, industrial producer prices
-
increased by 1.8% for intermediate goods,
-
increased by 0.3% for energy,
-
increased by 0.3% for capital goods,
-
increased by 0.3% for durable consumer goods,
-
remained stable for non-durable consumer goods.
Prices in total industry excluding energy increased by 0.9%.
The highest monthly increases in industrial producer prices were recorded in Denmark (+3.0%), Croatia (+2.7%) and Belgium (+2.4%). Decreases were observed in France (-2.1%), Estonia (-0.8%) and Sweden (-0.3%).
Annual comparison by main industrial grouping and by Member State
In the euro area in April 2026, compared with April 2025, industrial producer prices
-
increased by 3.9% for intermediate goods,
-
increased by 12.3% for energy,
-
increased by 2.1% for capital goods,
-
increased by 2.7% for durable consumer goods,
-
decreased by 0.2% for non-durable consumer goods.
Prices in total industry excluding energy increased by 2.3%.
In the EU, industrial producer prices
-
increased by 3.7% for intermediate goods,
-
increased by 12.6% for energy,
-
increased by 1.9% for capital goods,
-
increased by 2.5% for durable consumer goods,
-
decreased by 0.2% for non-durable consumer goods.
Prices in total industry excluding energy increased by 2.1%.
The highest annual increases in industrial producer prices were recorded in Bulgaria (+14.5%), Lithuania (+13.1%) and Romania (+11.5%). Decreases were observed in Luxembourg (-3.7%), Estonia (-1.2%), Cyprus (-0.7%) and Latvia (-0.6%).
Tables
|
Industrial producer prices on the domestic market % change compared with previous month |
||||||
|---|---|---|---|---|---|---|
|
Nov-25 |
Dec-25 |
Jan-26 |
Feb-26 |
Mar-26 |
Apr-26 |
|
|
0.8 |
-0.3 |
0.7 |
-0.6 |
3.4 |
0.6 |
|
|
0.1 |
0.1 |
0.6 |
0.2 |
0.4 |
0.9 |
|
|
0.3 |
0.3 |
1.0 |
0.3 |
0.7 |
1.8 |
|
|
2.8 |
-1.2 |
1.3 |
-2.5 |
11.0 |
-0.4 |
|
|
0.2 |
0.0 |
0.6 |
0.3 |
0.3 |
0.3 |
|
|
0.3 |
0.2 |
0.8 |
0.2 |
0.1 |
0.3 |
|
|
-0.2 |
-0.2 |
-0.2 |
-0.2 |
0.3 |
0.0 |
|
|
0.8 |
-0.4 |
0.8 |
-0.5 |
3.1 |
0.7 |
|
|
0.1 |
0.1 |
0.5 |
0.2 |
0.4 |
0.9 |
|
|
0.3 |
0.3 |
0.9 |
0.3 |
0.8 |
1.8 |
|
|
2.6 |
-1.4 |
1.6 |
-1.8 |
10.0 |
0.3 |
|
|
0.1 |
0.1 |
0.6 |
0.2 |
0.3 |
0.3 |
|
|
0.3 |
0.1 |
0.8 |
0.3 |
0.2 |
0.3 |
|
|
-0.2 |
-0.2 |
-0.2 |
-0.2 |
0.3 |
0.0 |
|
|
Industrial producer prices on the domestic market % change compared with previous month |
||||||
|---|---|---|---|---|---|---|
|
Nov-25 |
Dec-25 |
Jan-26 |
Feb-26 |
Mar-26 |
Apr-26 |
|
|
0.8 |
-0.3 |
0.7 |
-0.6 |
3.4 |
0.6 |
|
|
0.8 |
-0.4 |
0.8 |
-0.5 |
3.1 |
0.7 |
|
|
0.8 |
0.4 |
1.7 |
0.3 |
2.1 |
2.4 |
|
|
1.6 |
1.4 |
7.1 |
0.2 |
-2.5 |
1.2 |
|
|
0.3 |
-0.2 |
-0.7 |
0.1 |
1.5 |
1.4 |
|
|
1.5 |
-1.9 |
1.2 |
1.4 |
2.3 |
3.0 |
|
|
0.0 |
-0.3 |
-0.6 |
-0.5 |
2.5 |
1.2 |
|
|
0.4 |
-3.0 |
13.7 |
0.1 |
-12.3 |
-0.8 |
|
|
4.4 |
-2.8 |
4.0 |
-2.6 |
5.0 |
0.4 |
|
|
1.6 |
-1.0 |
0.0 |
1.5 |
5.2 |
0.3 |
|
|
-0.4 |
0.3 |
0.6 |
-3.0 |
6.2 |
1.7 |
|
|
2.8 |
0.2 |
0.6 |
-0.3 |
1.9 |
-2.1 |
|
|
0.6 |
-0.4 |
-0.2 |
3.8 |
0.9 |
2.7 |
|
|
1.3 |
-0.9 |
2.0 |
-0.8 |
5.9 |
0.1 |
|
|
-0.4 |
0.2 |
-0.6 |
0.1 |
-1.0 |
0.3 |
|
|
0.4 |
-1.5 |
3.2 |
0.3 |
-3.9 |
0.2 |
|
|
1.1 |
-0.8 |
1.3 |
1.5 |
7.1 |
2.2 |
|
|
-0.2 |
0.0 |
-3.5 |
0.4 |
0.5 |
0.4 |
|
|
0.3 |
-0.1 |
0.0 |
-0.2 |
3.4 |
0.0 |
|
|
0.1 |
-0.1 |
0.3 |
0.3 |
0.4 |
0.0 |
|
|
0.3 |
-1.1 |
1.6 |
-0.3 |
2.4 |
2.1 |
|
|
0.5 |
-0.5 |
0.0 |
0.1 |
1.8 |
0.5 |
|
|
0.0 |
-0.4 |
-0.3 |
0.5 |
3.8 |
0.7 |
|
|
-0.4 |
0.5 |
-0.2 |
-1.7 |
3.0 |
2.1 |
|
|
-0.1 |
0.1 |
2.6 |
-1.6 |
1.6 |
1.7 |
|
|
0.8 |
0.2 |
0.3 |
0.4 |
0.1 |
0.3 |
|
|
-0.9 |
0.3 |
-0.6 |
0.2 |
-1.0 |
2.1 |
|
|
0.3 |
-1.6 |
6.9 |
2.7 |
-5.3 |
2.2 |
|
|
1.9 |
-1.1 |
5.1 |
0.5 |
-2.1 |
-0.3 |
|
|
3.3 |
-0.5 |
6.1 |
0.7 |
0.0 |
1.9 |
|
|
0.0 |
-0.1 |
-0.4 |
-0.4 |
0.3 |
0.3 |
|
|
Industrial producer prices on the domestic market % change compared with same month of previous year |
||||||
|---|---|---|---|---|---|---|
|
Nov-25 |
Dec-25 |
Jan-26 |
Feb-26 |
Mar-26 |
Apr-26 |
|
|
-1.3 |
-2.0 |
-2.1 |
-3.0 |
2.0 |
4.9 |
|
|
1.0 |
1.0 |
1.2 |
1.1 |
1.4 |
2.3 |
|
|
0.5 |
0.8 |
1.5 |
1.3 |
2.0 |
3.9 |
|
|
-6.0 |
-8.4 |
-8.9 |
-11.7 |
4.0 |
12.3 |
|
|
1.8 |
1.7 |
1.6 |
1.6 |
1.7 |
2.1 |
|
|
2.0 |
2.1 |
2.2 |
2.5 |
2.4 |
2.7 |
|
|
1.2 |
1.0 |
0.4 |
0.2 |
0.1 |
-0.2 |
|
|
-1.1 |
-1.9 |
-1.9 |
-2.7 |
2.0 |
4.9 |
|
|
0.9 |
0.9 |
1.1 |
1.0 |
1.3 |
2.1 |
|
|
0.3 |
0.6 |
1.2 |
1.0 |
1.7 |
3.7 |
|
|
-5.3 |
-7.7 |
-7.9 |
-10.5 |
4.3 |
12.6 |
|
|
1.7 |
1.6 |
1.5 |
1.5 |
1.6 |
1.9 |
|
|
1.8 |
1.7 |
2.0 |
2.2 |
2.3 |
2.5 |
|
|
1.3 |
1.0 |
0.5 |
0.2 |
0.1 |
-0.2 |
|
|
Industrial producer prices on the domestic market % change compared with same month of previous year |
||||||
|---|---|---|---|---|---|---|
|
Nov-25 |
Dec-25 |
Jan-26 |
Feb-26 |
Mar-26 |
Apr-26 |
|
|
-1.3 |
-2.0 |
-2.1 |
-3.0 |
2.0 |
4.9 |
|
|
-1.1 |
-1.9 |
-1.9 |
-2.7 |
2.0 |
4.9 |
|
|
0.4 |
-0.2 |
0.9 |
1.0 |
3.6 |
8.1 |
|
|
13.8 |
9.8 |
11.7 |
9.2 |
7.5 |
14.5 |
|
|
-1.3 |
-2.1 |
-2.9 |
-2.8 |
-1.1 |
1.1 |
|
|
-0.7 |
-3.1 |
-3.5 |
-3.8 |
1.7 |
7.2 |
|
|
-2.2 |
-2.4 |
-2.9 |
-3.2 |
0.0 |
1.9 |
|
|
3.2 |
-0.9 |
11.9 |
2.4 |
-2.4 |
-1.2 |
|
|
-3.6 |
-4.9 |
-6.9 |
-4.6 |
1.9 |
6.5 |
|
|
0.9 |
-0.5 |
-2.1 |
-0.6 |
3.3 |
5.9 |
|
|
-2.4 |
-3.0 |
-2.9 |
-6.9 |
3.1 |
8.2 |
|
|
-1.5 |
-2.0 |
-2.3 |
-2.4 |
0.0 |
2.1 |
|
|
2.9 |
0.1 |
-1.7 |
1.7 |
2.9 |
8.1 |
|
|
-0.3 |
-2.0 |
-2.1 |
-3.7 |
5.4 |
8.8 |
|
|
0.2 |
0.3 |
-0.1 |
0.4 |
-0.7 |
-0.7 |
|
|
1.4 |
-0.4 |
3.2 |
-0.6 |
-1.2 |
-0.6 |
|
|
0.1 |
-1.8 |
-1.6 |
-0.9 |
7.4 |
13.1 |
|
|
-8.2 |
-8.3 |
-11.0 |
-10.4 |
-10.8 |
-3.7 |
|
|
-1.7 |
-2.0 |
-2.8 |
-3.0 |
1.3 |
2.2 |
|
|
1.0 |
0.9 |
1.2 |
1.0 |
1.5 |
1.3 |
|
|
-0.6 |
-1.5 |
-1.7 |
-2.8 |
1.5 |
5.4 |
|
|
-2.8 |
-3.6 |
-3.0 |
-2.7 |
-1.1 |
1.3 |
|
|
-2.0 |
-2.1 |
-2.4 |
-1.9 |
1.8 |
3.1 |
|
|
-3.8 |
-3.7 |
-1.9 |
-4.3 |
0.6 |
4.5 |
|
|
4.8 |
6.3 |
9.1 |
2.7 |
7.6 |
11.5 |
|
|
1.3 |
1.2 |
2.0 |
2.9 |
2.4 |
2.5 |
|
|
0.8 |
-0.4 |
-1.3 |
-0.3 |
-1.3 |
2.6 |
|
|
1.6 |
0.1 |
4.9 |
7.9 |
2.2 |
5.4 |
|
|
2.6 |
1.3 |
4.2 |
3.5 |
4.1 |
5.8 |
|
|
2.1 |
1.0 |
4.6 |
4.2 |
8.4 |
11.0 |
|
|
-0.5 |
-0.7 |
-0.9 |
-1.5 |
-1.3 |
-1.2 |
|
|
Industrial producer prices indices on the domestic market for total industry (base year 2021) |
||||||
|---|---|---|---|---|---|---|
|
Nov-25 |
Dec-25 |
Jan-26 |
Feb-26 |
Mar-26 |
Apr-26 |
|
|
125.1 |
124.7 |
125.6 |
124.8 |
129.0 |
129.8 |
|
|
126.8 |
126.3 |
127.3 |
126.7 |
130.6 |
131.5 |
|
|
120.3 |
120.8 |
122.8 |
123.2 |
125.8 |
128.8 |
|
|
145.5 |
147.5 |
158.0 |
158.3 |
154.4 |
156.3 |
|
|
129.7 |
129.4 |
128.5 |
128.6 |
130.5 |
132.3 |
|
|
148.9 |
146.1 |
147.9 |
149.9 |
153.4 |
158.0 |
|
|
126.6 |
126.2 |
125.5 |
124.9 |
128.0 |
129.5 |
|
|
133.7 |
129.7 |
147.5 |
147.7 |
129.6 |
128.6 |
|
|
108.5 |
105.5 |
109.7 |
106.8 |
112.1 |
112.5 |
|
|
125.1 |
123.9 |
123.9 |
125.8 |
132.3 |
132.7 |
|
|
124.8 |
125.2 |
125.9 |
122.1 |
129.7 |
131.9 |
|
|
123.0 |
123.3 |
124.0 |
123.6 |
125.9 |
123.2 |
|
|
131.1 |
130.6 |
130.4 |
135.3 |
136.5 |
140.2 |
|
|
127.0 |
125.8 |
128.3 |
127.3 |
134.8 |
135.0 |
|
|
124.4 |
124.6 |
123.8 |
123.9 |
122.7 |
123.1 |
|
|
140.9 |
138.8 |
143.3 |
143.8 |
138.2 |
138.5 |
|
|
134.7 |
133.6 |
135.4 |
137.4 |
147.1 |
150.4 |
|
|
140.2 |
140.2 |
135.3 |
135.8 |
136.5 |
137.1 |
|
|
185.5 |
185.3 |
185.3 |
184.9 |
191.1 |
191.1 |
|
|
110.4 |
110.3 |
110.6 |
110.9 |
111.3 |
111.3 |
|
|
122.9 |
121.6 |
123.6 |
123.2 |
126.2 |
128.8 |
|
|
118.3 |
117.7 |
117.7 |
117.8 |
119.9 |
120.5 |
|
|
122.4 |
121.9 |
121.5 |
122.1 |
126.7 |
127.6 |
|
|
115.1 |
115.7 |
115.5 |
113.5 |
116.9 |
119.4 |
|
|
167.7 |
167.8 |
172.2 |
169.5 |
172.2 |
175.1 |
|
|
133.0 |
133.3 |
133.7 |
134.2 |
134.4 |
134.8 |
|
|
135.3 |
135.7 |
134.9 |
135.2 |
133.9 |
136.7 |
|
|
118.1 |
116.2 |
124.2 |
127.6 |
120.8 |
123.4 |
|
|
122.2 |
120.8 |
127.0 |
127.6 |
124.9 |
124.5 |
|
|
140.8 |
140.1 |
148.7 |
149.8 |
149.8 |
152.7 |
|
|
112.3 |
112.2 |
111.8 |
111.3 |
111.6 |
111.9 |
|
|
Industrial producer prices indices on the domestic market for total industry excluding energy (base year 2021) |
||||||
|---|---|---|---|---|---|---|
|
Nov-25 |
Dec-25 |
Jan-26 |
Feb-26 |
Mar-26 |
Apr-26 |
|
|
119.3 |
119.4 |
120.1 |
120.3 |
120.8 |
121.9 |
|
|
119.6 |
119.7 |
120.3 |
120.5 |
121.0 |
122.1 |
|
|
125.4 |
126.7 |
129.3 |
129.2 |
129.2 |
130.9 |
|
|
144.1 |
145.3 |
147.5 |
149.5 |
150.2 |
150.2 |
|
|
120.0 |
119.9 |
120.1 |
120.0 |
120.5 |
121.7 |
|
|
121.2 |
121.3 |
121.2 |
121.4 |
121.5 |
122.0 |
|
|
120.8 |
120.9 |
121.5 |
121.6 |
122.2 |
123.0 |
|
|
123.5 |
123.9 |
125.0 |
125.1 |
125.6 |
126.4 |
|
|
116.6 |
116.7 |
117.1 |
118.7 |
120.1 |
119.9 |
|
|
118.1 |
118.4 |
118.6 |
119.0 |
119.4 |
119.6 |
|
|
118.0 |
118.0 |
118.7 |
119.0 |
119.6 |
121.2 |
|
|
118.0 |
118.1 |
118.6 |
118.7 |
119.0 |
119.7 |
|
|
119.4 |
119.3 |
119.2 |
119.4 |
119.3 |
119.5 |
|
|
116.0 |
116.0 |
116.5 |
116.7 |
117.2 |
117.9 |
|
|
120.7 |
121.0 |
121.2 |
121.5 |
121.8 |
122.1 |
|
|
129.3 |
129.1 |
129.6 |
129.3 |
129.8 |
130.5 |
|
|
123.4 |
123.2 |
124.5 |
123.9 |
124.3 |
126.9 |
|
|
119.1 |
119.2 |
119.7 |
120.7 |
121.6 |
122.5 |
|
|
147.2 |
147.3 |
147.8 |
148.1 |
149.4 |
150.1 |
|
|
122.5 |
122.4 |
122.9 |
123.8 |
124.5 |
124.5 |
|
|
120.0 |
119.8 |
120.3 |
120.6 |
121.5 |
125.1 |
|
|
118.1 |
118.3 |
118.7 |
119.1 |
119.5 |
120.8 |
|
|
113.2 |
112.8 |
112.6 |
112.9 |
113.7 |
114.4 |
|
|
118.1 |
118.3 |
118.9 |
119.4 |
120.1 |
120.9 |
|
|
133.9 |
135.2 |
135.7 |
136.2 |
137.1 |
138.5 |
|
|
126.2 |
126.4 |
126.9 |
127.5 |
128.4 |
128.9 |
|
|
120.9 |
121.4 |
120.9 |
119.9 |
119.8 |
122.6 |
|
|
119.3 |
119.1 |
119.6 |
120.2 |
120.6 |
121.2 |
|
|
126.0 |
126.2 |
127.0 |
127.1 |
127.5 |
128.6 |
|
|
133.1 |
133.5 |
138.5 |
140.1 |
140.0 |
140.5 |
|
|
108.8 |
108.7 |
108.6 |
108.0 |
107.9 |
108.0 |
|
Notes for users
Revisions and timetable
Compared with data issued in the News Release of 6 May 2026, the monthly percentage increase for March 2026 remained unchanged at +3.4% in the euro area and has been revised from +3.2% to +3.1% in the EU. The annual percentage increase has been revised from +2.1% to +2.0% in the euro area and remained unchanged at +2.0% in the EU.
Methods and definitions
The index of producer prices shows (in the national currency of the country concerned) changes in the ex-works sale prices of all products sold on the domestic market, excluding imports. Euro area and EU indices refer to overall weighted price changes. The figures are not calendar day or seasonally adjusted.
Total industry covers NACE rev.2 sections B to D + E36.
Geographical information
Euro area (EA21) includes Belgium, Bulgaria, Germany, Estonia, Ireland, Greece, Spain, France, Croatia, Italy, Cyprus, Latvia, Lithuania, Luxembourg, Malta, the Netherlands, Austria, Portugal, Slovenia, Slovakia and Finland.
The European Union (EU27) includes Belgium, Bulgaria, Czechia, Denmark, Germany, Estonia, Ireland, Greece, Spain, France, Croatia, Italy, Cyprus, Latvia, Lithuania, Luxembourg, Hungary, Malta, the Netherlands, Austria, Poland, Portugal, Romania, Slovenia, Slovakia, Finland and Sweden.